
by Gretchen Schrafft, Science Communication Specialist | Illustrations by Joyce Gao '24, Jones lab manager/research assistant
AS A MATHEMATICS PH.D. beginning a postdoctoral fellowship at Mass General Hospital in 2001, Stephanie Jones looked at EEG recordings of the electrical patterns in patients’ brains and wondered if she could use math to describe how the signals were generated.

“In graduate school, I learned how to describe the electrical signaling of brain cells using math, but only in very simplified networks,” said Jones, a professor of neuroscience at the Carney Institute. “When I arrived at MGH, I realized I had an opportunity to expand this mathematical framework to study the generation of human brain signals.”
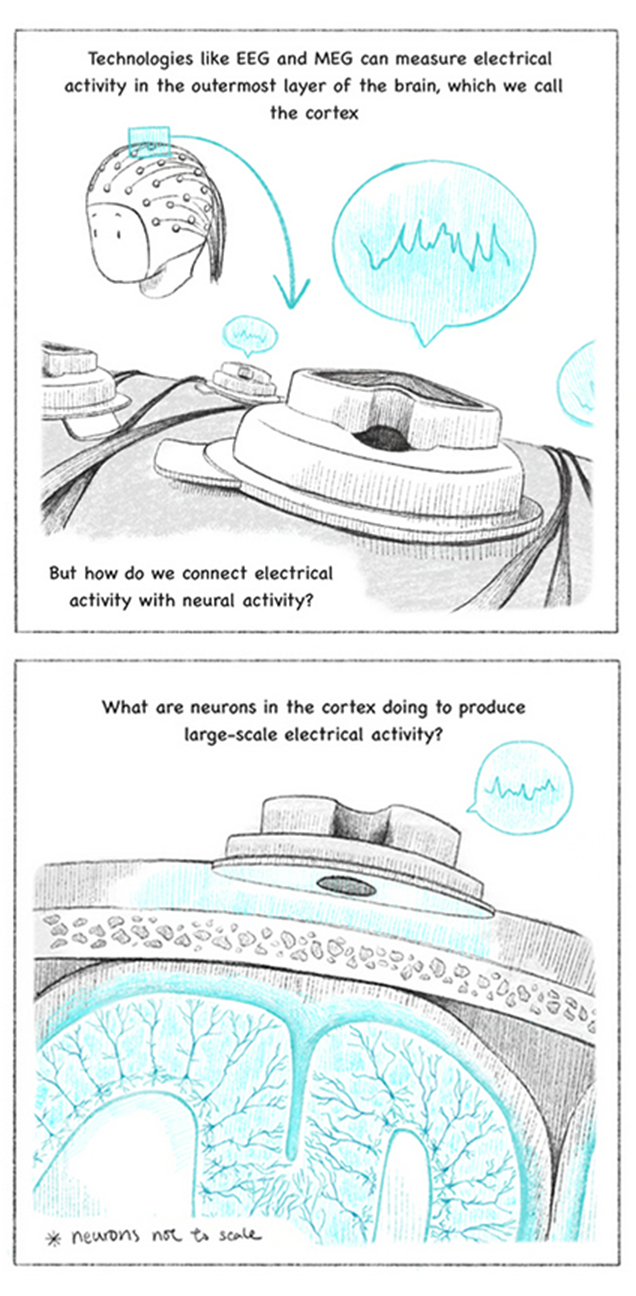
An electroencephalogram, or EEG, is a cost-effective and widely used technique to non-invasively record electrical activity in the brain through electrodes placed on the scalp. Similar to its cousin technique magnetoencephalography (MEG), which measures magnetic fields created by the electrical activity, EEG records waves of activity in patterns that can be categorized according to their frequency, amplitude, and shape, as well as by the sites on the scalp where they are recorded. Clinicians use EEG and MEG to screen patients for various brain-related conditions, or to monitor whether a particular treatment is having an effect, by tracking changes in waveform patterns.
 When he saw Jones give a presentation about the HNN, he saw a perfect framework to test his hypothesis. The two labs have now completed initial studies on Maestú’s data – years’ worth of MEG recordings from patients experiencing early cognitive decline, some of whom later developed Alzheimer’s disease. The team